Meta Ads metrics show where a campaign is earning money and where it is losing it, as long as you calculate them the same way every week. This guide gives you 40 formulas grouped by funnel stage. It ends with a diagnostic table that maps each weak number to the fix most likely to improve it.
Most Ads Manager reports stop at CPM, CTR and ROAS. That leaves out most of the story, because ROAS is the last number in a chain. If you only check the end of the chain, you can’t tell which part broke: the first three seconds of the video, the landing page, the cart, or your margin.
Key Takeaways
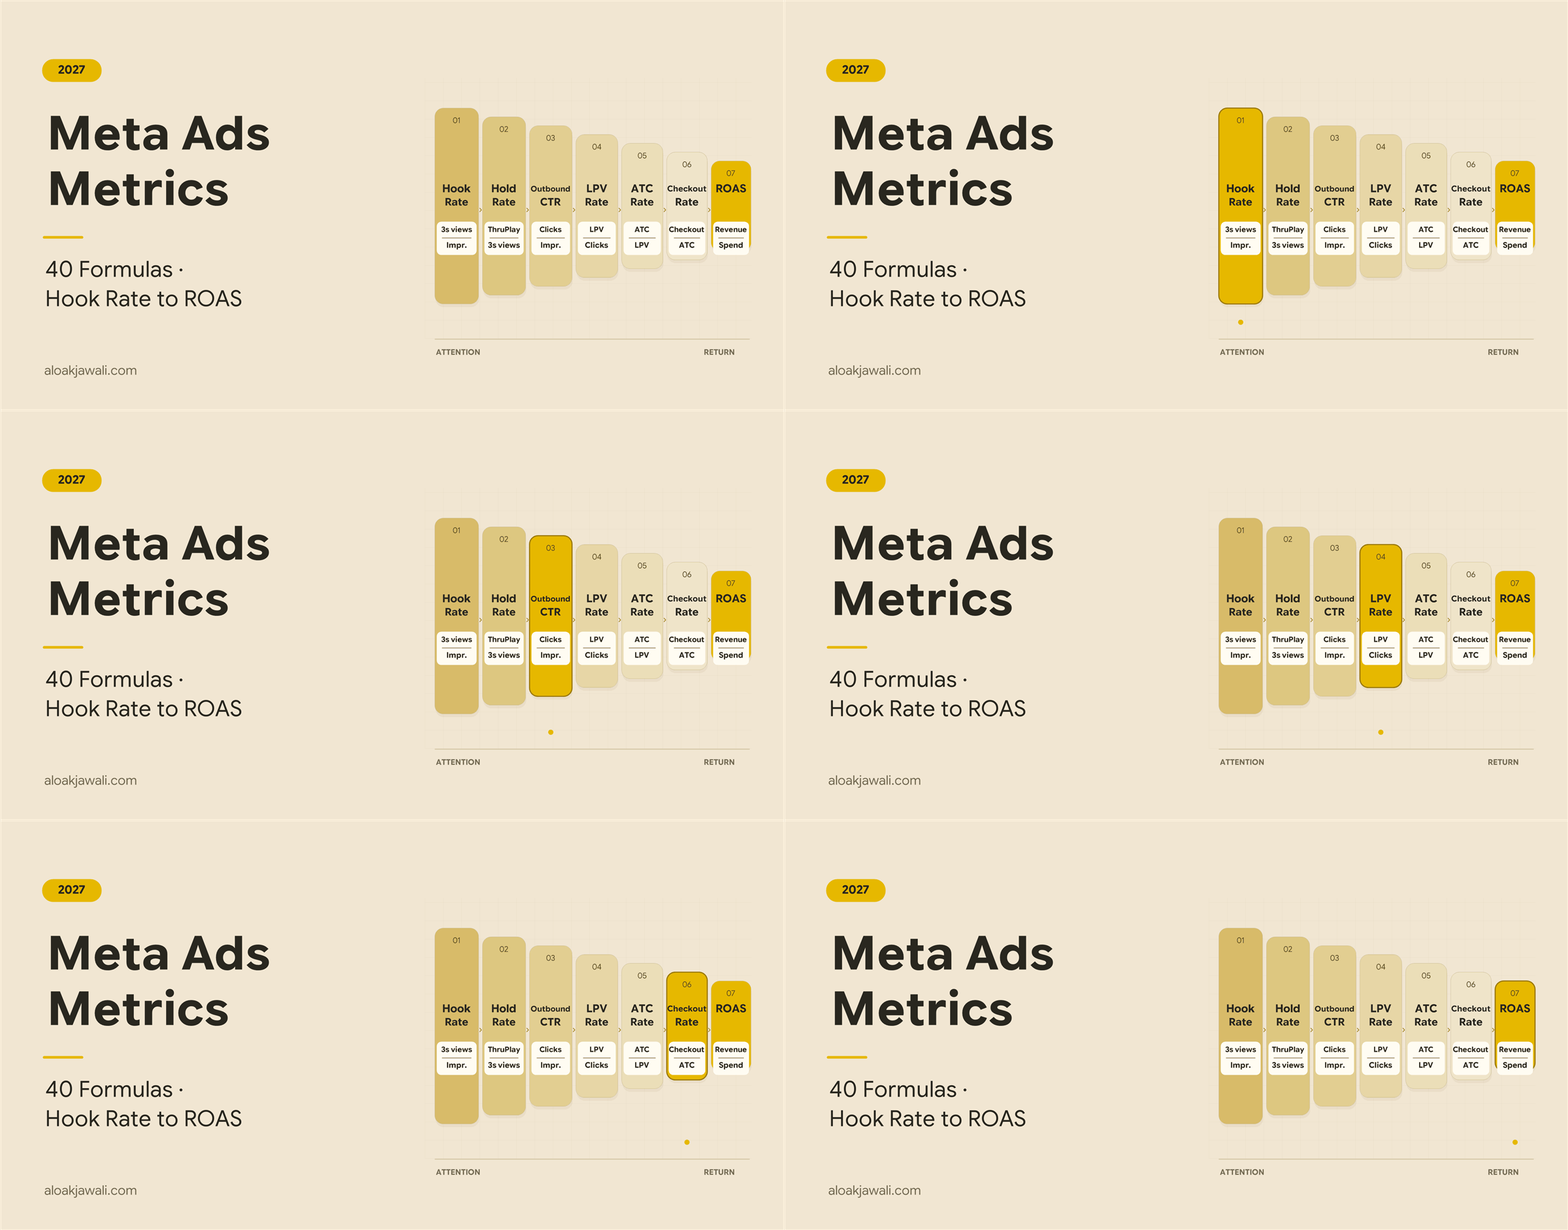
- Read Meta Ads metrics in funnel order: Hook Rate → Hold Rate → Outbound CTR → LPV Rate → ATC Rate → Checkout Rate → ROAS.
- Hook Rate and Hold Rate are custom metrics, not native Meta columns. Always label your definition, especially now that a ThruPlay can mean 6 or 15 seconds.
- ROAS measures revenue efficiency, not profit. Compare it with your break-even ROAS (1 ÷ contribution margin).
- Funnel ratios built from Meta pixel events are directional. Use Shopify or your store analytics for exact site conversion data.
Meta Ads metrics funnel from hook rate to ROAS for eCommerce brands
What Are Meta Ads Metrics?
Meta Ads metrics describe how your Facebook and Instagram ads are delivered, watched, clicked and converted, and what that activity is worth to your business. Some come straight from Ads Manager, such as impressions, reach, link clicks, ThruPlays and purchases. Others are ratios you build yourself as custom metrics or in a spreadsheet, such as Hook Rate, LPV Rate and break-even ROAS.
Two raw counts sit underneath almost every formula in this guide:
- Impressions: the total number of times your ads were displayed. One person can create several impressions, so impressions are not unique views.
- Reach: the number of unique people who saw your ad at least once.
It helps to group Meta Ads metrics by the question each one answers:
- Did the creative stop the scroll? (video metrics)
- What did that attention cost, and did people click? (delivery and click metrics)
- Did visitors move toward a purchase? (funnel metrics)
- Did the business make money? (profitability metrics)
Video Creative Meta Ads Metrics: Hook Rate, Hold Rate and Retention
Video metrics tell you whether a creative is working before any traffic reaches your store. These are the Meta Ads metrics most often missing from standard reports.
| # | Metric | Formula | What it tells you |
|---|---|---|---|
| 1 | Hook Rate (Thumbstop Rate) | (3-Second Video Plays ÷ Impressions) × 100 | How well the opening stops the scroll |
| 2 | Hold Rate | (ThruPlays ÷ 3-Second Video Plays) × 100 | How many hooked viewers keep watching |
| 3 | 6-Second Hold Rate | (6-Second Video Plays ÷ 3-Second Video Plays) × 100 | Retention right after the hook |
| 4 | 25% Video Retention | (Video Plays at 25% ÷ Video Plays) × 100 | Viewers reaching a quarter of the video |
| 5 | 50% Video Retention | (Video Plays at 50% ÷ Video Plays) × 100 | Viewers reaching the halfway point |
| 6 | 75% Video Retention | (Video Plays at 75% ÷ Video Plays) × 100 | Viewers reaching three-quarters |
| 7 | Video Completion Rate | (Video Plays at 100% ÷ Video Plays) × 100 | Viewers reaching the end |
| 8 | Cost per ThruPlay | Spend ÷ ThruPlays | Cost of a qualifying video view |
| 9 | Cost per 3-Second Play | Spend ÷ 3-Second Video Plays | Cost of each hooked viewer |
Hook Rate and Thumbstop Rate use the same formula, so report only one of them to avoid double-counting in your dashboard.
Label your Hold Rate definition: a ThruPlay is now 6 or 15 seconds
Hook Rate and Hold Rate are widely used custom metrics, not standardized Meta columns. Some advertisers calculate Hold Rate as 15-second plays ÷ 3-second plays instead of using ThruPlays.
The ThruPlay definition itself has also changed:
- The long-standing default: According to Meta’s Business Help Center, a ThruPlay is a play to completion for videos under 15 seconds, or at least 15 seconds for longer ones, and 97% of the runtime counts as complete.
- The November 2026 option: Ads Manager now shows a “ThruPlay duration” field that lets advertisers in the Awareness and Engagement objectives choose 6 seconds instead of the 15-second default. It works for both auction and reservation buying.
- Where the news came from: The change surfaced in a LinkedIn post by Bram Van der Hallen on November 16, 2026, not in a Meta announcement. The post does not say whether reporting columns follow the selected duration. (PPC Land coverage)
This matters for your formulas. Every view that reaches 15 seconds has also passed 6 seconds, so a 6-second setting can only produce an equal or higher ThruPlay count and a lower cost per ThruPlay, even when viewing behaviour hasn’t changed. Hold Rate rises for the same reason.
Put the definition in the column name, for example “Hold Rate (TP15)” or “Hold Rate (TP6).” Never compare ad sets that use different ThruPlay durations.
How to read the video metrics together
- Low Hook Rate: the first three seconds are weak. Test a new opening visual, a pattern break, or on-screen text that states the main benefit.
- High Hook Rate, low Hold Rate: the opening promises something the next seconds don’t deliver. Tighten the pacing and show the product sooner.
- High Hold Rate, low CTR: people enjoy the video but see no reason to click. Rework the offer and the call to action.
Core Meta Ads Metrics for Delivery, Clicks and Cost
| # | Metric | Formula | What it means |
|---|---|---|---|
| 10 | CPM | (Spend ÷ Impressions) × 1,000 | Cost per 1,000 impressions (not 1,000 people) |
| 11 | CPC (Link) | Spend ÷ Link Clicks | Cost per link click |
| 12 | CTR (Link) | (Link Clicks ÷ Impressions) × 100 | Link click-through rate |
| 13 | CTR (All) | (All Clicks ÷ Impressions) × 100 | Includes likes, profile taps and “see more” expands |
| 14 | Outbound CTR | (Outbound Clicks ÷ Impressions) × 100 | Traffic that actually leaves Meta |
| 15 | Cost per Outbound Click | Spend ÷ Outbound Clicks | Cost of an off-platform click |
| 16 | LPV Rate | (Landing Page Views ÷ Link Clicks) × 100 | Share of clicks that load your page |
| 17 | Cost per LPV | Spend ÷ Landing Page Views | Cost of a real page visit |
| 18 | Frequency | Impressions ÷ Reach | Average exposures per person |
| 19 | Engagement Rate | (Engagements ÷ Impressions) × 100 | Interaction relative to delivery |
| 20 | CPL | Spend ÷ Leads | Cost to generate a lead |
| 21 | CPA | Spend ÷ Acquisitions | Cost per action you define |
| 22 | ROAS | Purchase Conversion Value ÷ Spend | Revenue per ₹1 of spend, not profit |
Three corrections are worth making in any reporting template:
- CPM measures the cost of 1,000 impressions, not 1,000 people.
- ROAS measures revenue efficiency, not profit.
- Impressions are ad displays, not unique views.
A low LPV Rate usually points to slow load times, redirects or broken tracking rather than weak creative. If your landing pages are JavaScript-heavy, these Claude prompts for technical SEO audits can help you find rendering and speed problems.
2026 benchmarks for context
Benchmarks help you sense-check your Meta Ads metrics, but they are not targets. Triple Whale’s Meta ads benchmarks report gives these figures:
- Sample: more than 40,000 brands using its platform, from August 2025 to July 2026.
- Medians: CPA of $38.99, CPM of $15.06 (up 13.24% year over year), conversion rate of 1.53%, ROAS of 1.88 and CTR of 2.39%.
- The trend to watch: median CTR rose almost 16% while conversion rate fell about 4.7%. More people are clicking, but fewer of those clicks become purchases. That is exactly why post-click metrics belong in your report.
The sample is mostly US-dollar eCommerce brands, so treat absolute costs as directional if you advertise in INR.
eCommerce Funnel Meta Ads Metrics: From Landing Page to Purchase
| # | Metric | Formula | What it means |
|---|---|---|---|
| 23 | Add to Cart Rate | (Adds to Cart ÷ LPVs) × 100 | Share of visits that add to cart |
| 24 | Cost per ATC | Spend ÷ Adds to Cart | Cost per add to cart |
| 25 | Initiate Checkout Rate | (Checkouts Initiated ÷ Adds to Cart) × 100 | Progression from cart to checkout |
| 26 | Cost per Checkout | Spend ÷ Checkouts Initiated | Cost per initiated checkout |
| 27 | Checkout Completion Rate | (Purchases ÷ Checkouts Initiated) × 100 | Share of checkouts that convert |
| 28 | Cart-to-Purchase Rate | (Purchases ÷ Adds to Cart) × 100 | Overall cart efficiency |
| 29 | Purchase Conversion Rate | (Purchases ÷ LPVs) × 100 | Share of page visits that buy |
| 30 | Cost per Purchase | Spend ÷ Purchases | Cost to generate a purchase |
| 31 | AOV | Revenue ÷ Orders | Average order value |
| 32 | Revenue per LPV | Revenue ÷ LPVs | Value of each landing page visit |
Funnel Meta Ads metrics built from pixel or Conversions API events are directional. They can include repeated events, attributed conversions and different user journeys. For precise conversion and abandonment analysis, use Shopify session and checkout data.
A high LPV count with a low Add to Cart Rate usually means a product or offer mismatch. Check pricing, reviews and trust signals on the product page. The same Product, Offer and review data also helps you in organic search. See which types of schema markup a D2C store should prioritize.
Profitability Meta Ads Metrics: Is Your ROAS Actually Profitable?
| # | Metric | Formula | What it means |
|---|---|---|---|
| 33 | Break-even ROAS | 1 ÷ Contribution Margin | Minimum ROAS needed to cover ad spend |
| 34 | Break-even CPA | AOV × Contribution Margin | Maximum sustainable cost per purchase |
| 35 | MER | Total Store Revenue ÷ Total Ad Spend | Business-wide marketing efficiency |
| 36 | New Customer CAC | Acquisition Spend ÷ New Customers | Cost to acquire one new customer |
| 37 | POAS | Contribution Profit Before Ads ÷ Ad Spend | Profit returned per ₹1 of spend |
| 38 | LTV:CAC | Customer LTV ÷ CAC | Long-term value efficiency |
| 39 | Ad Spend Ratio | (Ad Spend ÷ Revenue) × 100 | Share of revenue spent on ads |
| 40 | Contribution Profit After Ads | Revenue − Variable Costs − Ad Spend | What is left after ads |
Express contribution margin as a decimal, such as 0.40 for 40%. Calculate it after cost of goods, shipping, payment fees and discounts, but before advertising.
Worked example (the ₹ amounts are illustrative):
- Inputs: AOV is ₹2,000 and contribution margin is 0.40.
- Break-even ROAS: 1 ÷ 0.40 = 2.5.
- Break-even CPA: ₹2,000 × 0.40 = ₹800.
- A campaign at ROAS 2.2: spend ₹1,000 and it returns ₹2,200 in revenue and ₹880 in contribution. After the ₹1,000 ad cost, that is a ₹120 loss on the first order. POAS is 0.88, and anything below 1.0 means you are losing money.
That ROAS of 2.2 is still above the 1.88 Triple Whale median, which shows why margin, not a benchmark, decides whether your ROAS is “good.” Scale a campaign below break-even only if repeat purchases and LTV:CAC justify it.
How to Diagnose Weak Meta Ads Metrics
Each weak number in your Meta Ads metrics points to a specific part of the funnel. Use this table before you change budgets or bids.
| Situation | Likely problem | What to check |
|---|---|---|
| High CPM | Expensive audience or inventory | Audience, placements, competition |
| Low Hook Rate | Weak first 3 seconds | Opening visual, hook, message |
| High Hook, low Hold | Opening attracts but doesn’t keep viewers | Pacing, storytelling, relevance |
| High Hold, low CTR | Interest without intent to click | Offer, CTA, product relevance |
| Low CTR | Creative or audience mismatch | Angle, headline, offer |
| High CPC | Low CTR and/or high CPM | Creative and delivery costs |
| High CTR, low LPV Rate | Landing page loading issue | Speed, redirects, tracking |
| High LPVs, low ATC | Product or offer mismatch | Product page, pricing, trust |
| High ATC, low checkout | Cart friction | Shipping, unexpected costs |
| High checkout, low purchase | Checkout friction | Payment, delivery, trust |
| Good ROAS, low profit | Weak contribution margin | COGS, shipping, discounts |
| High frequency, falling CTR | Possible creative fatigue | Frequency trend, audience saturation |
The 9 Meta Ads Metrics to Add to Your Custom Report First
If you run an eCommerce brand, start your custom reporting view with these nine:
- Hook Rate: 3-second video plays ÷ impressions × 100
- Hold Rate: ThruPlays ÷ 3-second video plays × 100 (label TP6 or TP15)
- Outbound CTR: outbound clicks ÷ impressions × 100
- LPV Rate: landing page views ÷ link clicks × 100
- ATC Rate: adds to cart ÷ landing page views × 100
- Checkout Rate: initiated checkouts ÷ adds to cart × 100
- Purchase CVR: purchases ÷ landing page views × 100
- ROAS: purchase conversion value ÷ spend
- Cost per Purchase: spend ÷ purchases
Not all of these Meta Ads metrics are native Ads Manager columns. Hook Rate, Hold Rate and the funnel ratios need custom metrics, calculated fields or a data export. Reliable profitability numbers usually mean combining Meta data with Shopify.
Read them in this order: Hook Rate → Hold Rate → Outbound CTR → LPV Rate → ATC Rate → Checkout Rate → Purchase ROAS. That sequence connects a creative’s ability to win attention with the revenue it produces, instead of judging an ad on ROAS alone.
Frequently Asked Questions
What are the most important Meta Ads metrics for eCommerce?
The most important Meta Ads metrics for eCommerce are Hook Rate, Hold Rate, outbound CTR, LPV Rate, Add to Cart Rate, Checkout Rate, purchase conversion rate, ROAS and cost per purchase. Add break-even ROAS so you can judge whether a campaign is profitable as well as efficient.
What is a good Hook Rate on Meta Ads?
Meta doesn’t publish an official Hook Rate benchmark, because it is a custom metric. Compare creatives within the same account, placement and audience. Treat the top quartile of your own ads as the bar new creatives have to beat.
How do you calculate break-even ROAS?
Divide 1 by your contribution margin expressed as a decimal. With a 40% margin, break-even ROAS is 1 ÷ 0.40 = 2.5. Any ROAS below that loses money on the first order.
Is Hold Rate the same as ThruPlay rate?
Usually, but not always. Hold Rate is most often calculated as ThruPlays ÷ 3-second plays. Some teams use 15-second plays instead, and Meta now lets some campaigns count a ThruPlay at 6 seconds. Always state which definition your report uses.
How often should I review Meta Ads metrics?
Review creative and delivery Meta Ads metrics (Hook Rate, CTR, CPM, frequency) weekly. Review funnel and profitability metrics (ATC Rate, checkout rate, break-even ROAS, MER) at least monthly, using store data alongside Meta’s attributed numbers.
Conclusion
Meta Ads metrics work best as a chain, not a scoreboard. Start with the hook, follow the viewer through the click, the landing page and the cart, and finish with margin. When ROAS drops, the chain tells you which link to fix. Above all, keep your definitions fixed, especially for ThruPlay-based metrics.
If you’d like help setting up a Meta Ads metrics dashboard that combines Ads Manager and Shopify data, work with Aloak Jawali, a digital marketing consultant in Bengaluru.